DATA SCIENCE / DATA ANALYSIS
Bike Sharing Analysis
An end-to-end analysis of Capital Bikeshare usage in Washington, D.C. during 2011 and 2012, covering data cleaning, exploration, visualization, and an interactive Streamlit dashboard.
View on GitHub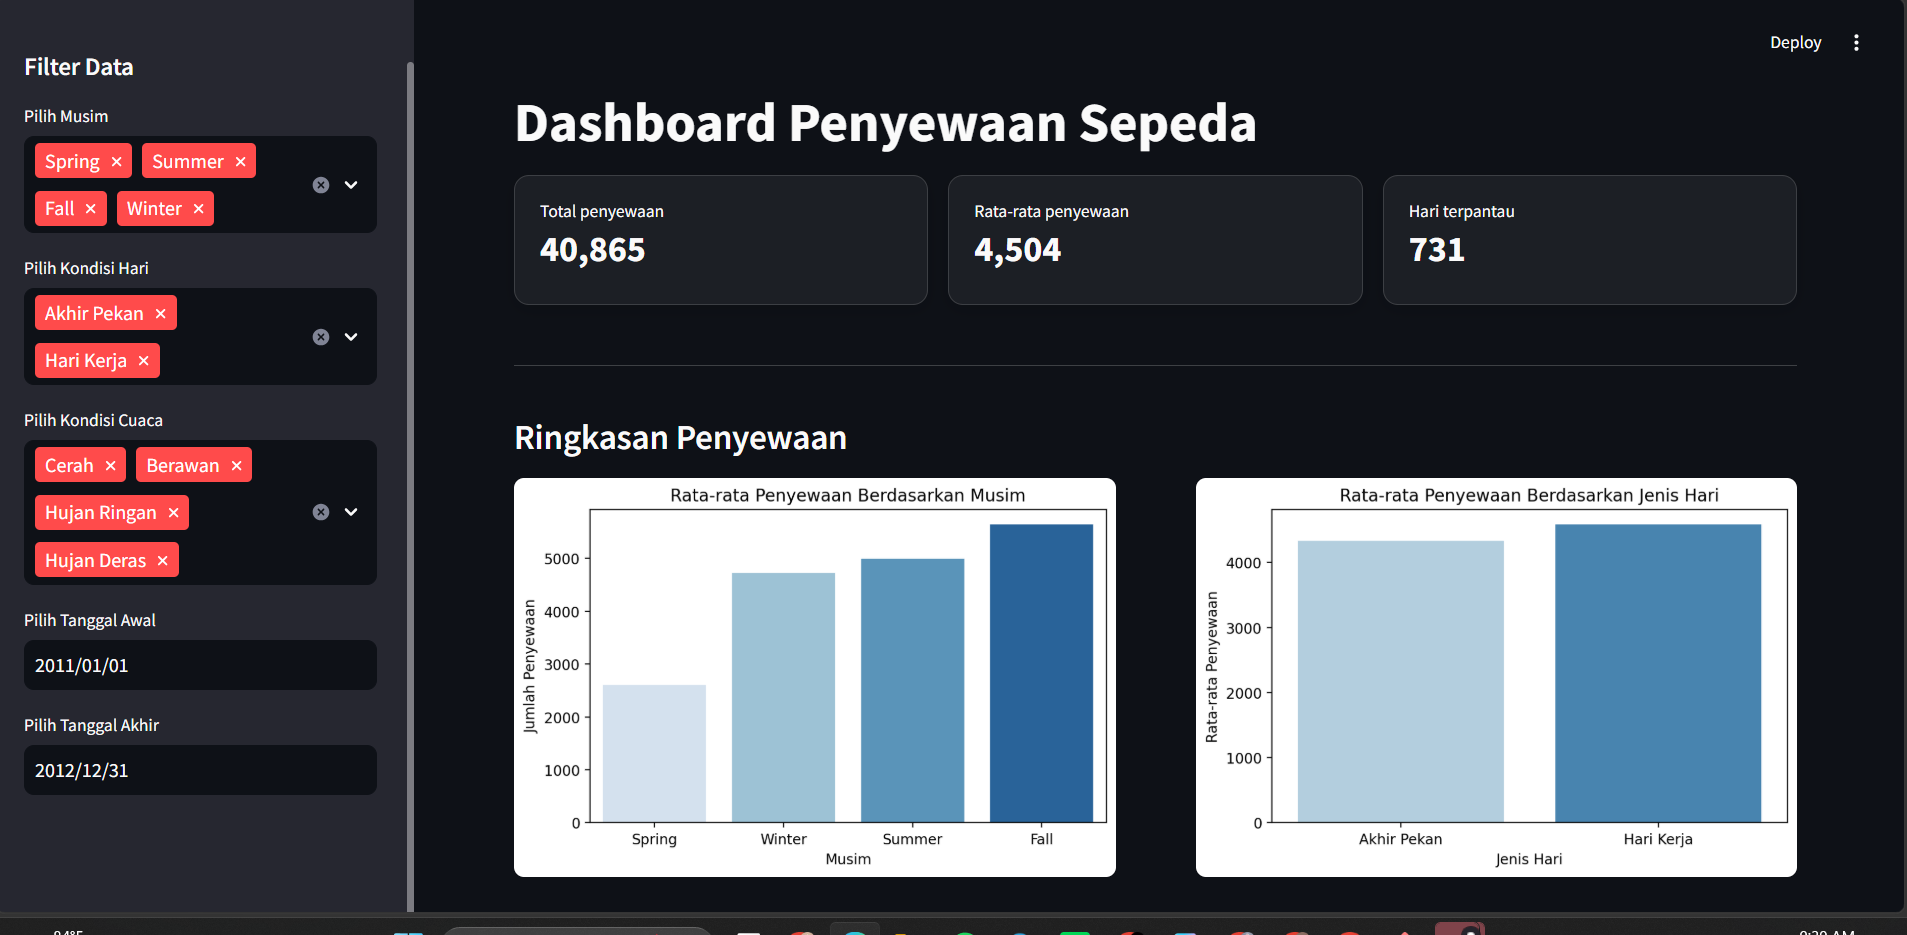
My Contribution
- Cleaned and prepared daily and hourly Bike Sharing datasets for analysis.
- Performed exploratory data analysis (EDA) to identify rental patterns across seasons, days, weather, and time categories.
- Analyzed rental trends and compared usage patterns between 2011 and 2012.
- Compared average rentals across weekdays and weekends.
- Analyzed the impact of weather conditions, temperature, and humidity on bike rental demand.
- Created data visualizations using Matplotlib and Seaborn to communicate key findings.
- Developed an interactive Streamlit dashboard with filters for season, day type, weather, and date range.